
Introduction and Students
The School District of Philadelphia matched the City of Philadelphia’s Out of School Time (OST) program participants with district student identification numbers to compare program participation to academic and behavioral outcomes at school. The first task of the analysis was to compare OST attendance for all participants to attendance for OST participants who were matched with a district student identification number. This analysis determined the degree to which there was a difference between the groups, with regard to program attendance. Table 1 describes the participants with district student identification numbers (“Matched Students”) and Table 2 describes all students identified as having participated in the City’s OST programs (“All Students”).

Table 2. Description of all students’ program attendance by year
Independent t-tests were conducted to determine the difference between the matched students and all participants of the OST programs for fiscal years 2011 and 2012 (fiscal years encompass July 1, 2010–June 30, 2011 and July 1, 2011–June 30, 2012, respectively). The 2011 analysis determined less than 1% of the variance in program participation was accounted for by difference between the matched students and all participants (r = 0.034). The 2012 analysis had similar findings (r = 0.024), determining that less than 1% of variance in 2012 program attendance was accounted for by difference between the identified students and all participants. These analyses conclude that the participants with student identification numbers represent all participants of OST programs with regard to total days attended. The analyses that follow include participants with student identification numbers only.
Student Attendance and Demographics
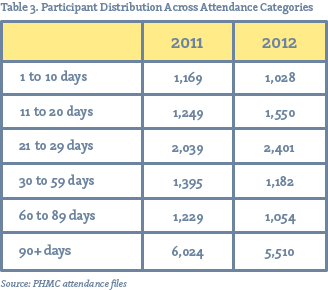
Total days attended were organized into attendance categories based on the 21st Century Community Learning Centers (21CCLC) attendance groupings, represented in Table 3. The 1–29 days attended was further broken down to take a closer look at participants who attended 29-day summer programs only. Students with high summer-only attendance are included in the “21 to 29 days attended” category. The attendance category with the most students is the “90+ days.” The “21-29 days attended” category is the smallest range of days but contains the highest number of students proportionally. These trends are observed for both the 2011 and 2012 fiscal years.
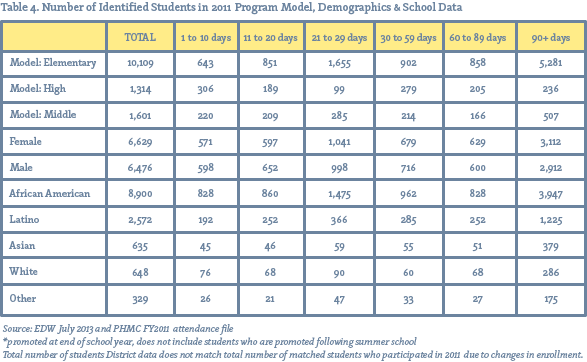
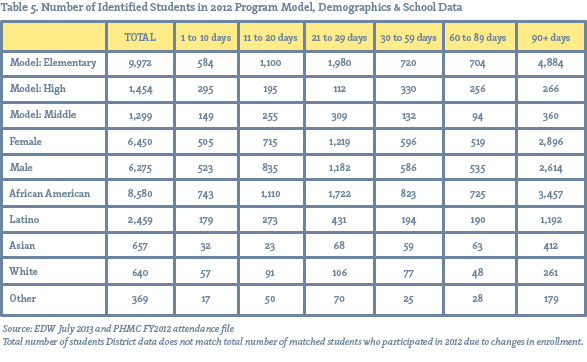
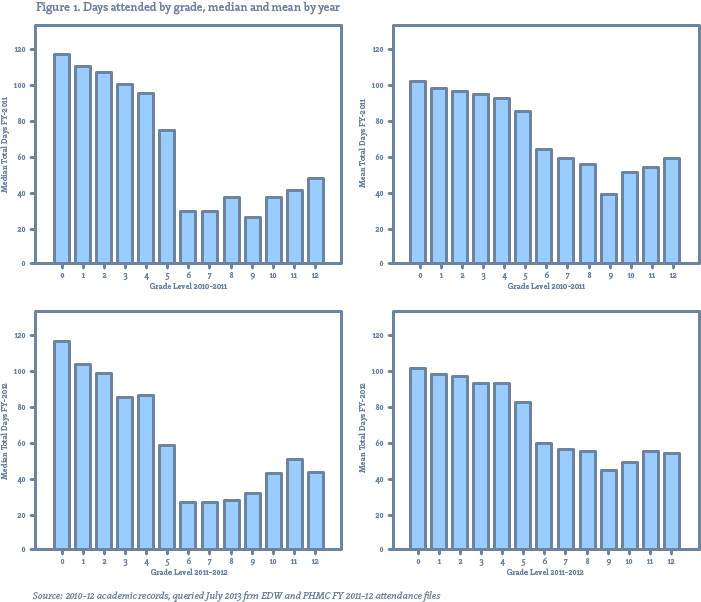
Student demographics and program models are compared for 2011 (Table 4) and 2012 (Table 5). The gender constitution of both years follows the same trend, with slightly more females. The racial make-up is predominantly African American and Latino, which represent the two largest racial groups district-wide. Elementary school programs make-up over 75% of total participants for 2011 and 2012. This group also shows excellent attendance, with about 50% of all participants in the “90+ days” attendance classification. The city confirmed that many of these students are enrolled in aftercare programs, for which attendance is a necessary part of their families’ work schedules. For this reason, student motivation for attendance is different in the elementary programs than it is in the middle and high programs. It is also true that students who elect to attend these programs should be qualitatively different than students who are placed in the programs out of necessity. A closer look at grade distribution is shown in Figure 1. Median attendance rates by grade are displayed in the left column and the mean attendance rates by grade are displayed in the right column for 2011 and 2012. For both years, mean attendance drops off dramatically after grade 5, supporting the role that after-care plays in OST program attendance. Further, the K-5 median attendance shows less variation than mean attendance. This suggests that a smaller sub-group of high-attenders in the K-5 grades offset the mean.
Academic and Behavior Outcomes
A common assertion of OST programs is that they improve academic and behavior outcomes. If OST participation is an agent of student outcomes, it is expected that greater participation rates are related to the best outcomes. Tables 6 and 7 arrange outcomes by program model and attendance categories. Truancy is defined as 10 or more absent days and is reported as a percentage of students in a group that qualify as truant during the respective school year. Average daily attendance (ADA) is the total number of school days attended over the total days enrolled. Perfect attendance is an ADA of 100%. The values are reported by program model and attendance category and represent the average student ADA for each category. Suspension is a behavioral indicator that is measured as total days of out-of-school suspensions. Suspensions are reported below in Tables 6 and 7 as an average for each student in the respective category. Finally, academic performance is reported below as promotion rates for grades K-8 and ratio of credits earned for grades 9-12. Promotion rates are based on the respective year’s final report card and do not account for summer school make-ups. Each value is the percentage of students recommended for promotion on their final report card. The ratio of credits earned is a calculation of total credits earned over total credits attempted. The values reported below represent the average ratio for all students in each category.
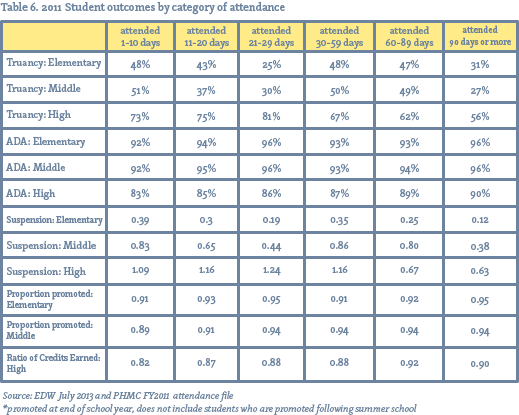
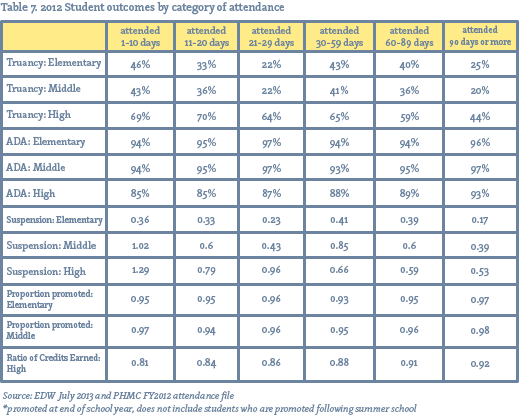
Figure 2 provides a visual analysis of student outcomes for ADA and suspension. Both years follow the same trends across attendance categories. The relationship between the attendance categories and outcomes is generally linear, with better outcomes predicted as days attended increases. Student outcomes for the “21-29 days attended” category deviate from this linear trend as students in this category have better attendance at school and lower rates of suspension than predicted by their participation in OST programs. This difference is likely accounted for by participants who attend summer programs only. A hypothesis may be formed that there is something qualitatively different about these students or something highly effective about these programs that accounts for the spike in outcomes that deviates from an otherwise mostly-linear relationship of attendance rates to outcomes. Further analysis of these students and a qualitative review of these programs may better clarify the difference demonstrated in Figure 2. Mean days suspended were compared across attendance categories using an ANOVA analysis, which found a statistically significant relationship (p<0.01). A statistically significant relationship was also found when ADA was compared across attendance categories (p<0.01).
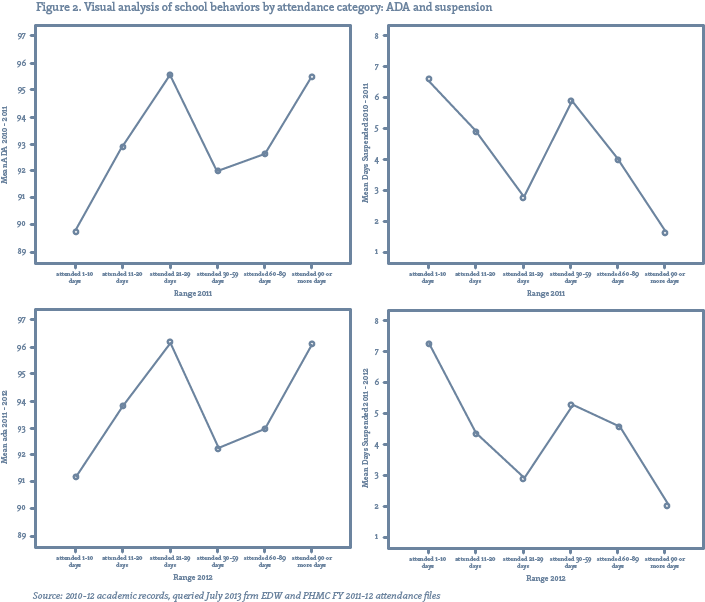
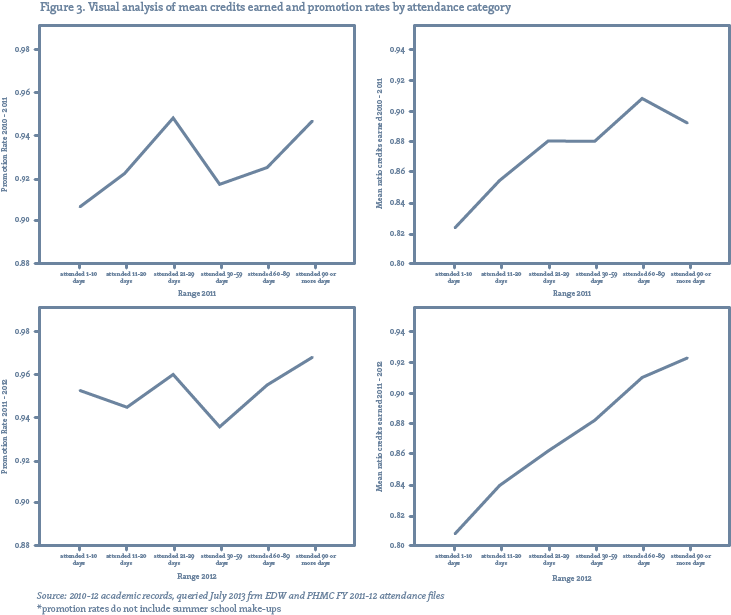
Figure 3 is a visual analysis of promotion rates and credits earned by attendance categories. For these analyses, the K-8 students are represented in the promotion rates (left column) and the high school students are represented in the ratio of credits earned (right column). The trend noted by Figure 2 regarding better outcomes for the “21-29 days” attendance category only appears in the promotion rates graphs. In contrast, the “21-29 days” attendance category falls into the larger trend for the high school students, a possible indication that the “summer-only” students are in elementary or middle school grades. The Spearman correlation for promotion rates and attendance category is 0.41 in 2011 and 0.42 in 2012. These values represent a consistent positive relationship across years. The ratio of credits earned were compared across attendance categories using an ANOVA and found a statistically significant relationship (p<0.01).
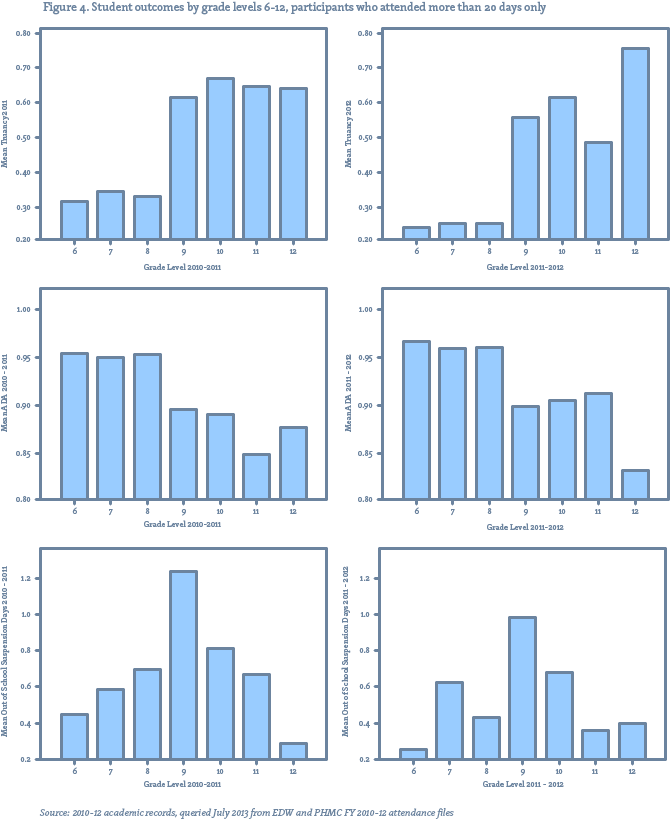
Due to the high number of K-5 participants and the difference in programming (i.e., aftercare) and attendance rates, these students account for most of the mean calculations when all grades are grouped. To take a closer look at grade-level difference of older participants, Figure 4 displays the mean truancy rates, ADA, and mean days suspended for grades 6-12. Only students who attended more than 20 days were included in the figure. Truancy rates increase dramatically from grade 8 to grade 9 for both years. Suspension rates spike in grade 9 and then improve through grade 12. This a typical trend in education data, as students who struggle behaviorally in grades 9 are more likely to drop out or receive a transfer to an alternative placement.
Conclusions
This report served as an initial collaboration between the district and the city toward demonstrating and tracking outcomes of OST programs. Regarding the demographics of participants, the racial and gender composition is consistent with the composition of the entire district. More than 75% of all participants are enrolled in the elementary model. It is likely that the elementary model is largely comprised of aftercare programs.
Regarding student outcomes, measures of academic and behavioral performance included truancy rates, average daily attendance, days of out-of-school suspension, promotion rates (grades K-8 only) and ratio of credits earned (grades 9-12 only). Using categories of OST attendance, outcomes were reported in tables and graphed for visual analysis. A consistent positive relationship between desirable academic and behavioral outcomes and attendance in OST programs was found. The greater the number of OST days attended predicted better outcomes across variables. These relationships were statistically significant and mostly linear, with the exception of the “21-29 days attended” category, for which outcomes deviated in a positive direction. Based on the data available, these deviations seem to represent students who attended summer programs only and may be mostly comprised of students who are in grades lower than 9-12 (based on the return to linearity of the ratio of credits earned, a measure that includes high school students exclusively).
For information about this report, please contact Valerie Evans (This email address is being protected from spambots. You need JavaScript enabled to view it.) or Tonya Wolford (This email address is being protected from spambots. You need JavaScript enabled to view it.).