
Abstract
This article presents an evaluation of the impact of the Commonwealth’s and MHSA’s first homeless social innovation Pay for Success (PFS) initiative on housing retention, utilization of emergency services, and cost-savings. The analysis methods used include: survival analysis to compute housing retention; Wilcoxon Signed-Rank test to find out the significance of differences between the before and after housing utilization of inpatient hospitalizations, outpatient hospital visits, emergency department (ED) visits, ambulance rides, days incarcerated; and a cost-benefit analysis to translate usage into dollar amounts. We found that after 365 days of PFS, the retention rate is 92.2 percent. In both the six-month and twelve-month analyses, we find significant reductions in utilization of emergency medical services but not incarceration. Cost savings on emergency medical services amount to $2.2 million. Overall, PFS is successful in housing and retaining homeless high utilizers while reducing costs to the public.
1. Introduction
Two years into the first “Housing First” social innovation financing initiative in Massachusetts, attention and interest have turned to its performance. Known as The Commonwealth’s and Massachusetts Housing and Shelter Alliance’s (MHSA) Pay for Success (PFS) initiative, the program aims to retain 85 percent of clients in housing, to improve health utilization outcomes for chronically homeless individuals and homeless high utilizers of emergency services. The “Housing First” component refers to a low-threshold permanent supportive housing intervention -- low-threshold because housing is provided to the client without preconditions such as detoxification. Supportive services are provided to the client on his/her own volition after entry into housing. Supportive services are also not a condition for maintaining tenure. This article presents the findings of the impact of PFS on housing retention, service utilization, and cost-savings.
Given the scarcity of resources, it is important to know whether social innovation financing is effective and efficient in efforts to end homelessness. Applying social innovation financing to the “Housing First” model is an effective innovation because the “Housing First” model is founded on rigorous research and is the U.S. federal government’s intervention of choice for ending chronic homelessness. Several studies published in reputable journals have demonstrated that following entry into housing, chronically homeless individuals use fewer inpatient hospital days, ambulance rides, emergency room visits, and gain access to much needed services such as treatment for alcohol and substance use disorders (Wright et al., 2016; Larimer et al., 2009; Flaming, 2009; Nogaski; 2009; Buchanan, et al., 2009; Perlman and Parvensky, 2006; Mondello, et al., 2007). However, we do not know for sure whether cost savings are made especially on emergency medical services. In testing the cost-benefit, this study is therefore important because a demonstration of efficiency will support implementation of best practices in ending homelessness.
2. Lessons from the Literature on Effects of The Housing First Model
Studies examining the effects of Housing First on the cost of health and correctional services can be observed in recent years, although rudimentary forms of the intervention can be seen in scholarly studies on psychiatric health from as early as 1980 (Stein & Test, 1980; Weisbrod, Test, & Stein, 1980). These early studies demonstrated that treating individuals with severe and persistent mental illnesses while they were based in their homes and while they participated in their community had better health benefits. They reduced the number of hospitalizations and length of re-hospitalizations, and had a modest cost-benefit over inpatient services. Studies by Hoult et al. (1983), Mulder (1985), Olfson (1990) Stein & Test (1980) and Test (1992) were in agreement with the earlier findings. Burns & Santos (1995) further confirmed these positive findings. In 1992, Dr. Sam Tsemberis then consolidated these ideas in relation to homeless, mentally ill individuals and developed what is referred to as the ‘Housing First Model”. After Dr. Tsemberis established his Pathways to housing Inc., the term “Housing First” came into prominent use.
At the turn of the century, evaluations of programs among non-profit organizations that address homelessness aimed to demonstrate effects of the model on retention and healthcare. From 1994 to 1998, Martinez & Burt (2006) evaluated the cost of supportive services for individuals with dual psychiatric and substance use disorders, demonstrating that support services led to a reduction in cost. Beginning in 1999, O’Connell et al. (2005) followed up with a study of a group of 119 homeless people in Boston, which he referred to as the “Rough Sleepers.” The study tracked the “Rough Sleepers” for five years and demonstrated a reduction in costs of healthcare after housing.
From the start of the new millennium onwards, a plethora of program evaluation reports by nonprofits and research centers emerged (Culhane, 2002 in New York; Moore, 2006 in Portland Oregon; Massachusetts Housing & Shelter Alliance, 2007 in Massachusetts; Mondello, 2007 in Maine; Linkins et al., 2008 in California; Hirsch, 2008 in Rhode Island; Bamberger and Considine-Cortelyou, 2008 in San Francisco; and Nogaski et al., 2009 in Illinois). These evaluations all demonstrated reductions in the utilization of services and costs. The Massachusetts Housing & Shelter Alliance (MHSA) was a leader in this movement in the Commonwealth of Massachusetts with its Home & Healthy for Good (HHG) program.
Up to this point, the evidence was still considered weak because of methodological questions. Many of these studies were pre-post (before and after) observational studies which did not use control groups and randomization. This meant that there was no way of knowing for sure that before and after differences were the result of housing. Also, the studies depended on clients reporting their public service usage rather than existing administrative records, which meant that the evidence was weak on account of recall bias. More recent studies have focused on using much more rigorous methods to strengthen the evidence, demonstrate a cost-benefit, and publication in peer-reviewed journals. New methods include pre-post control designs with propensity score matching. There is also an increase in scholarly publications in respectable peer-reviewed journals. These include Wright et al. (2016) in Oregon, Mackelprang et al. (2014) in Seattle, Buchanan et al. (2009) and Larimer et al. (2009) in Seattle. They all report a significant reduction in utilization of services after housing. Much more is yet to be done, particularly in counteracting competing explanations for observed differences.
Overall, notwithstanding the importance of housing, and utilization of public, and especially health services, the question we address is whether the costs of administering Housing First programs are less than the costs prior to entering permanent housing.
3. Social Innovation Financing and MHSA’s Pay for Success Program
Social Innovation Financing (SIF) is a creative approach to outcome based programming. SIF contracts are where “intermediaries” enter into Pay for Success contracts with the government. The government contracts with an intermediary which is responsible for operating the program. The intermediary establishes partnerships with private sector investors. In these partnerships, investors provide a portion of the program funds up front to the intermediary. Then the government will reimburse the intermediary if the program is successful, which in-turn will repay the investors.
MHSA’s Pay for Success program is a permanent supportive housing initiative serving between 500 and 800 homeless individuals over six years, starting from June 2015. To implement this program, MHSA has partnered with Santander Bank, United Way of Massachusetts Bay and Merrimack Valley (UWMB), and the Corporation for Supportive Housing (CSH). Together they have formed a Limited Liability Company (LLC) called Massachusetts Alliance for Supportive Housing (MASH). MASH serves as an intermediary organization between investors, providers, and the Commonwealth. Santander Bank serves solely as an investor, UWMB serves as both an investor and fiscal agent, and CSH serves as both an investor and evaluation expert. Additionally, Root Cause serves as an external evaluator.
By 2019, Pay for Success aims to house and retain 500 to 800 homeless adults that meet HUD’s (2016) “chronic homeless” definition, as well as long-term homeless adults who are high utilizers of emergency services. All potential clients are evaluated with a triage and assessment tool, created by MHSA and Boston Health Care for the Homeless, to help in efficient targeting of clients. The triage and assessment tool predicts which individuals are likely to incur the highest emergency medical costs based on their self-reported health issues and current usage of emergency services.
4. Data and Methods
As observed in the literature review, the ideal design is a randomized controlled trial (RCT) which is more rigorous but often not possible due to ethical considerations and housing cost constraints. The prevailing program evaluation method is a cost-benefit analysis. In this evaluation, we conduct a cost-benefit analysis using a one-group pre-post design. This provides an observational view of before and after conditions. MHSA is pursuing efforts to match the program data to MassHealth data and then use a pre-post control design that matches housed and non-housed individuals using propensity score analysis.
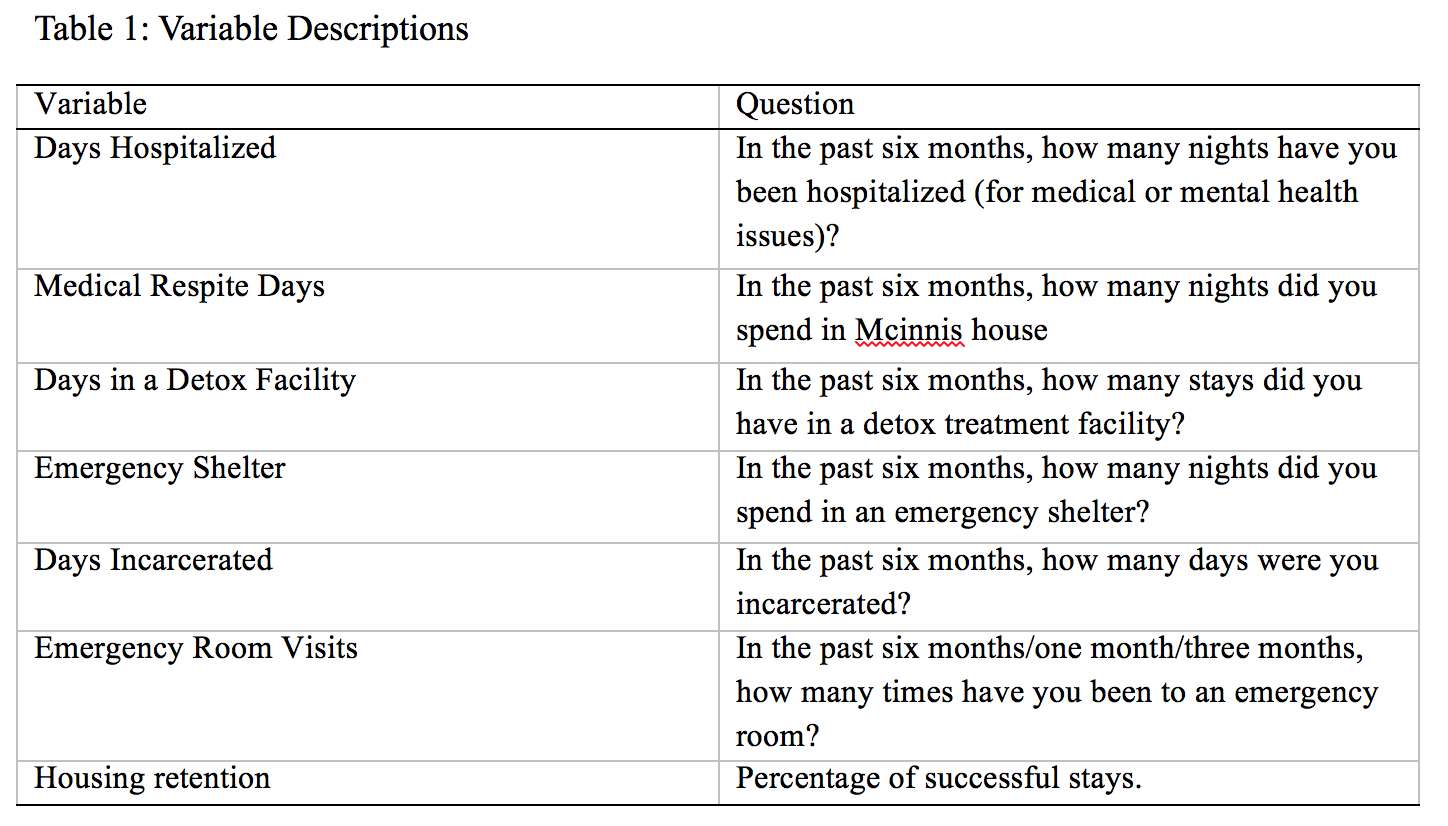
We use Pay for Success program data, which are collected in four main stages. The first stage is the triage and assessment stage. At this stage, data is collected from potential clients during assessment for PFS housing -- as explained in the previous paragraph. Potential clients are evaluated with a triage and assessment tool, which is in the form of a questionnaire. Providers administer the tool, and enter the data into ClientTrack, the PFS online database. Data include demographics, homeless history, utilization of emergency services, physical health, mental health, substance use, and domains for computing prioritization and assessment scores. Second is the housing entry stage. Data is collected at housing entry. The data include demographics, homelessness history, income sources, health insurance, quality of life, disability, and health history and service usage six months before housing. Third is the monthly follow up stage. Follow up data is collected every month after housing entry. The data fields are the same ones collected at housing entry. Finally, after 12 monthly follow up interviews the quarterly follow up stage begins. Data is collected every quarter. Although the intervals between follow-up and quarterly follow-up interviews differ, the data fields are the same. The variables we analyze are shown in Table 1 below.
The first part of our analysis consists of clients who have been in the program for at least six months -- clients who have at least six follow up interviews after housing entry. This is the main focus of the before and after analysis because it covers a significant portion of the total number of clients in the program (343 out of 424) based on the December 31, 2016 count. The Wilcoxon Signed-Rank test is employed to test for the significance of differences between use before and after housing entry. The Wilcoxon Signed-Rank test is a form of a dependent samples t-test used when data do not satisfy parametric assumptions (data are not normally distributed). In other words, it is a test employed when the data show concentration of service-use among a few individuals while the majority use fewer services. We follow up this analysis with a robustness check by analyzing data only on clients who have been in the program for at least one year (175 clients). Comparison of service usage is done between six months before and after housing entry, as well as between six months before and the six-month period from the seventh to the twelfth month after housing entry. Comparing these three six-month segments ensures that the units of analysis are the same to allow for comparison.
To compute housing retention, survival analysis is employed. Survival analysis is a statistical method also referred to as time to event analysis. It is used where the interest is in finding out how long it takes for an event to take place, and for predicting the likelihood that it will take place.
There are some limitations with the overall design and data that the reader ought to be aware of. Firstly, the evaluation uses an observational design and therefore does not control for any unobserved factors. Typical of program data, this data is self-reported which leaves it susceptible to recall bias. In the triage and assessment and housing entry stages, clients recollect events of the previous six months. During the monthly and quarterly follow up interviews, clients recall events of the previous month and three months respectively. Additionally, self-reported data can be susceptible to social desirability bias. For example, typically, homeless clients avoid the social stereotype that mental disability is socially undesirable which leads to underreporting. The results are interpreted and presented with these design and data limitations in mind.
5. Results
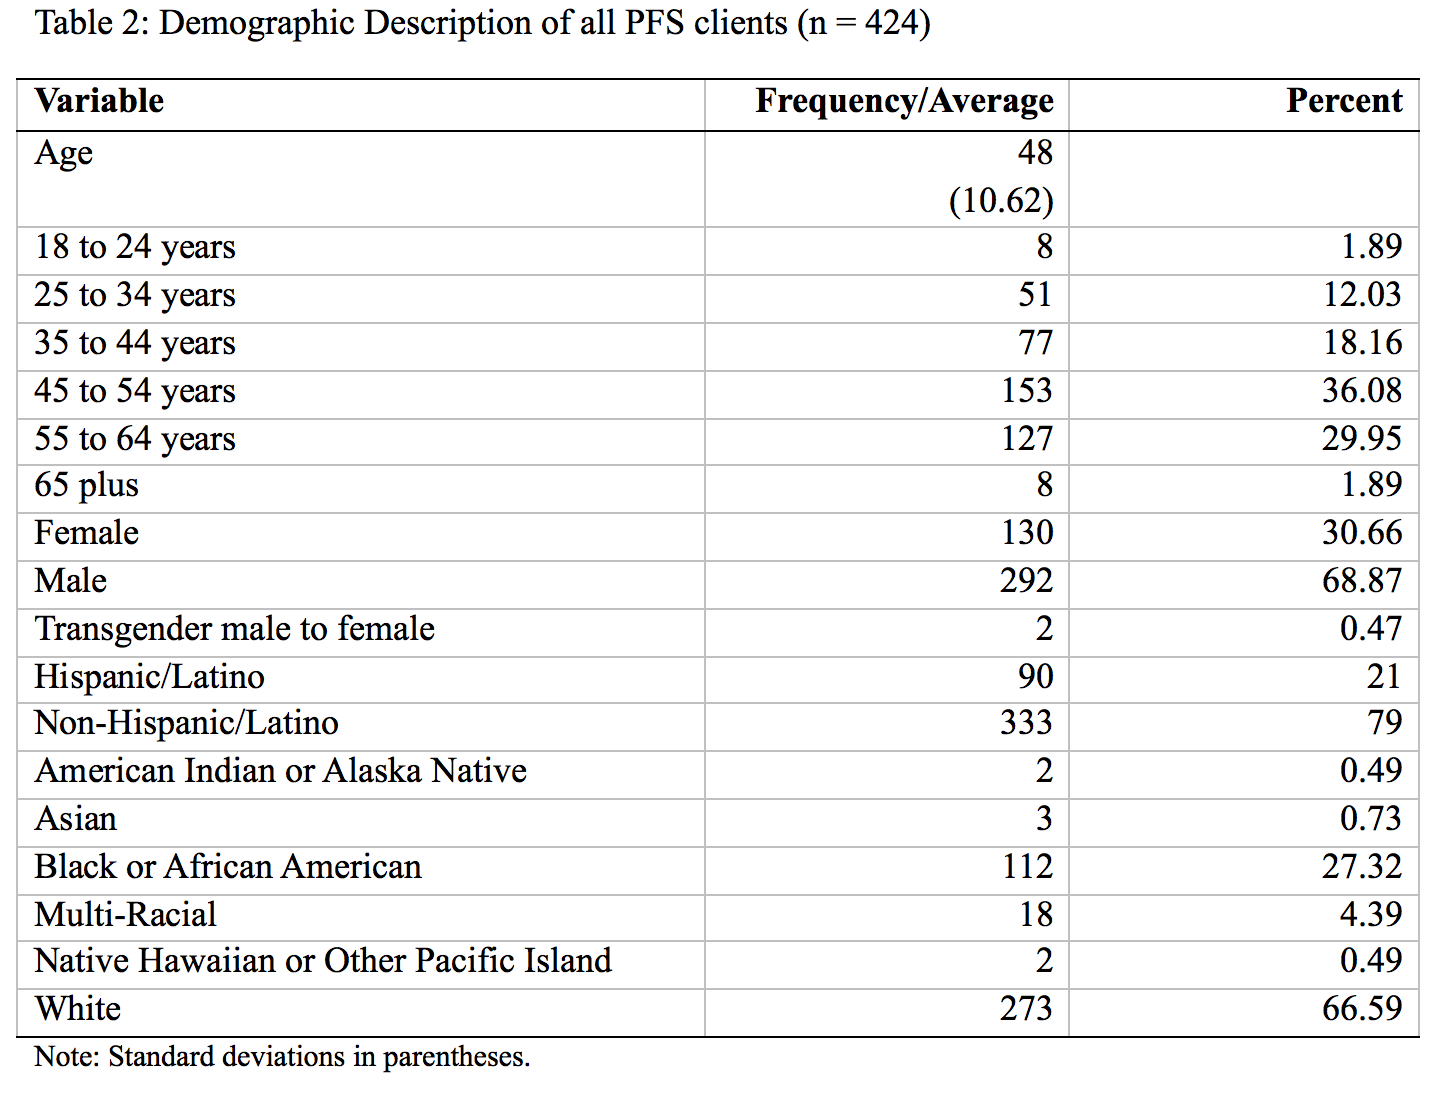
This section of the report describes the aggregate demographics of PFS clients who were part of the evaluation. First, we describe the statistics for all clients, then for those who were in the program for at least six months and finally for those who were in the program for at least one year. Since the commencement of the program in June 2015 through to December 2016, 424 clients were enrolled in the program. Of these, 343 had been in the program for at least six months and 175 for a year. The average age of all clients was 48 years with a standard deviation of 10.62, showing that the typical client is about to become an elder adult. As Table 2 shows, most clients were between the age of 45 and 54 (153) followed by those between 55 and 64 years (127). The clients are predominantly male with only a third female and less than a percent transgender. In terms of ethnicity and race, the majority of clients identify as non-Hispanic/Latino, accounting for 79 percent. Two-thirds identify as white, a little over a quarter as black or African American, and 5 percent as multi-racial.
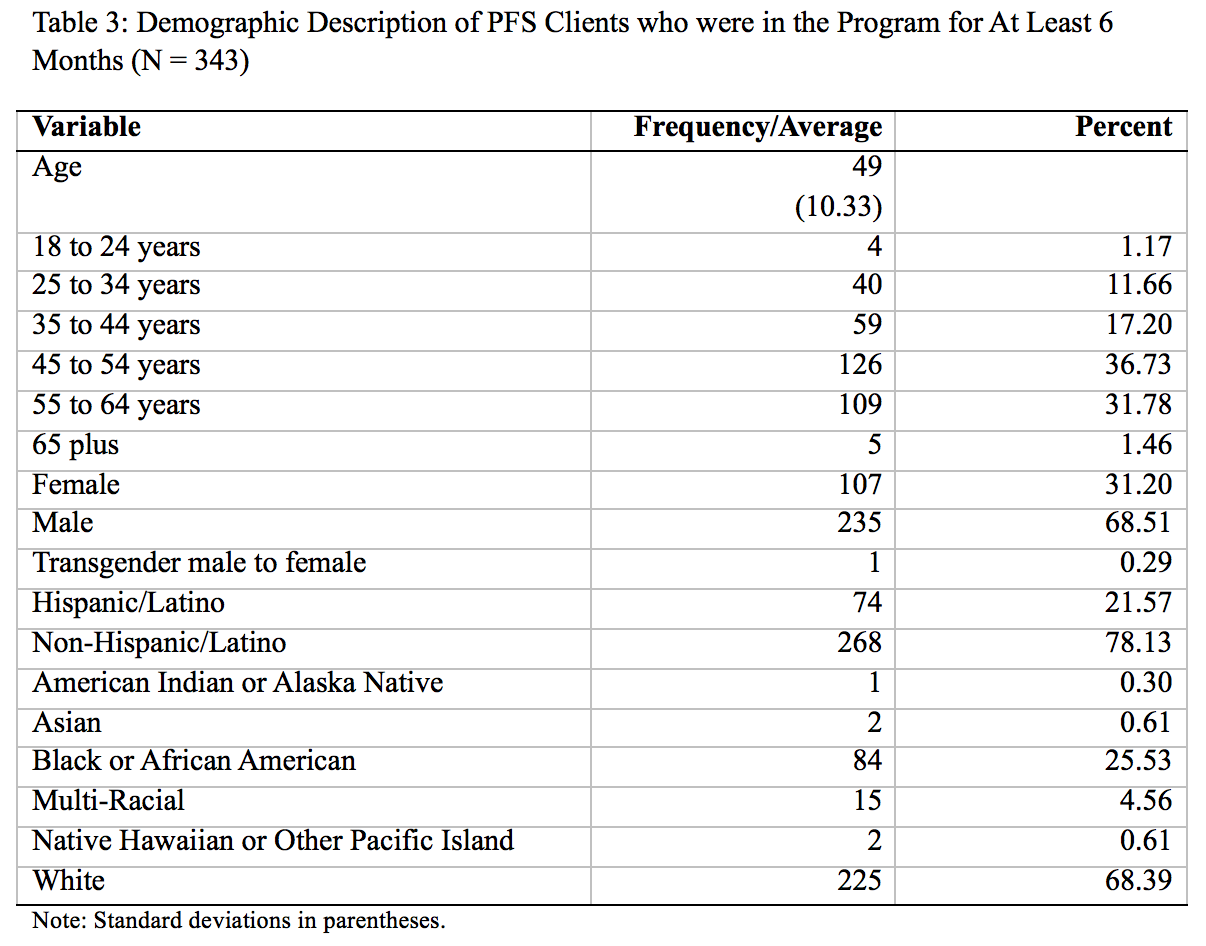
As Table 3 above shows, the average age of the 343 clients who had been in the program for at least six months was 49 years, with a standard deviation of 10.33. Broken down in terms of age groups, 126 clients were between ages 45 and 54 while 109 were between 55 and 64 years. In terms of other demographics, 69 percent were male, 22 percent were of Hispanic descent, and 68 percent were of white descent. Those of Black or African American descent made up 26 percent while those of multi-racial descent made up about 5 percent.
5.1. Use of Public Services 6 Months after Housing
In this section, are results of the comparison between service usage six months prior to and six months after housing entry for clients who are in the program for at least six months.
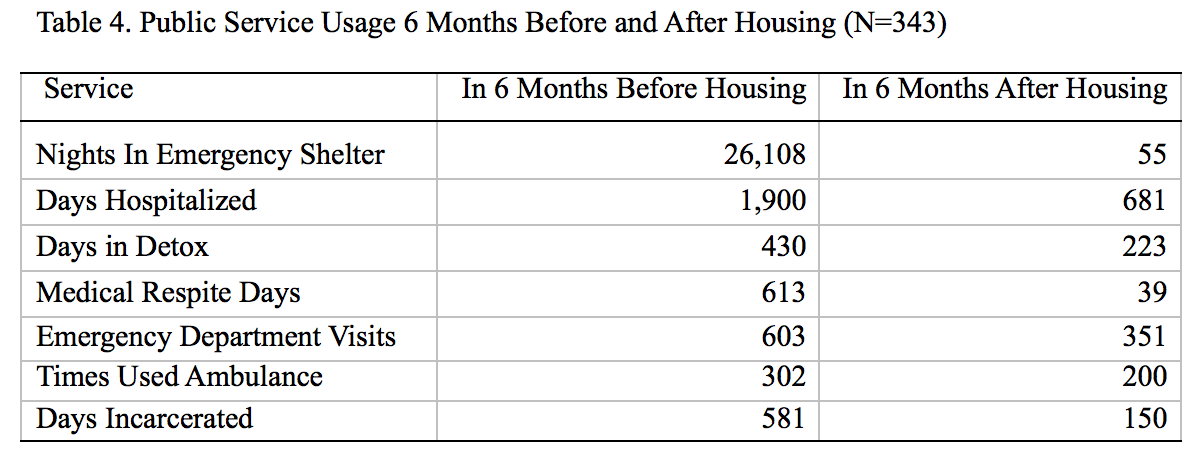
Collectively, the 343 PFS clients who had been in the program for at least six months spent 26,108 nights in emergency shelters across the state in the six months before entry into PFS housing. In the six months after, the same individuals spent 55 nights. This translates to 26,053 fewer days than would have been spent in the shelter system. A question may be raised as to why we see clients spending nights in shelter after they have been housed. One answer lies in the fact that after moving in some clients wish to move into a different unit from the unit that they have been allocated. They temporarily move into shelter before they move into their preferred apartment.
Clients spent a total of 1,900 hospitalization days. This means that at the time they were chronically homeless, each client spent an average of six days. In the six months after entering permanent supportive housing, clients spent 681 days, or an average of two days each. Clients spent 1,219 fewer inpatient hospitalization days after housing entry. The fact that the evidence shows a reduction of this magnitude supports the theory that permanent supportive housing reduces utilization of inpatient hospitalizations. This result is consistent with what other programs using the housing first model find.
Table 4 also reports the number of days PFS clients spent in alcohol and substance use detox facilities. In the six months before housing entry, clients spent 430 days. In the six months after, clients spent 223 days. The difference translates to 207 fewer days. This may mean that after housing entry, fewer chronically homeless individuals needed detox. We see that the number of days in detox does not reduce completely as expected, which we attribute to the fact that many clients are starting to access services and still dealing with the challenges of substance use and addiction.
Turning to medical respite days, we see that PFS clients utilized 613 days in the six months before housing entry. In the six months that they were in PFS housing, clients spent 39 days, a large difference of 574 fewer days. The National Health Care for the Homeless Council (2012) defines medical respite as “acute and post-acute medical care for homeless persons who are too ill or frail to recover from a physical illness or injury on the streets, but who are not ill enough to be in a hospital.” This means that while under PFS, clients experienced fewer days requiring acute medical care. Clients had fewer days of exposure to the elements and health hazards that go with living on the streets and lacking shelter as a result of PFS housing.
An important and high cost service regularly utilized by chronically homeless individuals is the emergency department. While many clients visit emergency rooms for medical emergencies, many also use it as a place of shelter, especially when emergency shelters are full and during severe weather conditions. During the six months prior to entering PFS housing, clients made 603 visits to the emergency room. After entering the program, the number of visits dropped to 351. In the time they were housed, clients made 252 fewer visits.
Related to emergency room visits is the number of times that clients were transported to the hospital by ambulance. As Table 4 shows, clients altogether used the ambulance 302 times in the six months prior to entry into PFS. In the six months after, they used the service 200 times, representing 102 fewer times. This means clients had fewer medical emergencies that required ambulance transportation in the six months they were in PFS.
Another public service that is frequented by chronically homeless individuals is the corrections system. Altogether, clients spent 581 days incarcerated in the six months prior to entry into PFS. In the six months after, they spent 150 days. The difference was 431 days. Not to say that some clients do not commit crimes that lead them into incarceration, other crimes, such as loitering, are because of a lack of shelter. Once clients were housed, they had fewer incidences and encounters with the corrections system as their primary need was met.
5.1.1. Significance of the Differences in Service Usage Before and After Housing
In this section, we test the statistical significance of the differences in service usage before and after housing entry. To compute this, we use the Wilcoxon Signed-Rank test because the distribution of service use for each service is skewed. A non-parametric test is appropriate in this case. Although we present mean scores in the table, the tests for the significance of the difference is based on the median difference. We present the mean for purposes of intuitive interpretation for the reader.
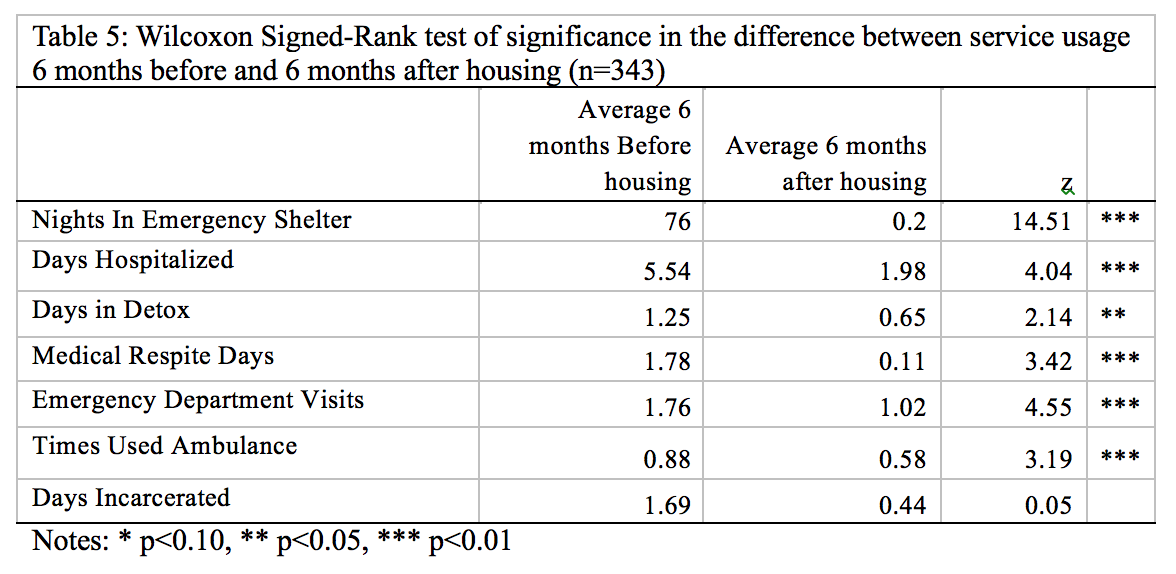
As Table 5 shows, there are statistically significant reductions in average utilization of health services but not in days incarcerated. All reductions are statistically significant at the one percent level indicating that we can be 99 percent confident that this is not by chance. We cannot claim for sure that the significant differences are caused by entry into PFS because our analysis does not control for any factors. However, we are confident in advancing the hypothesis that entry into PFS housing plays an important role based on the theory and results of empirical studies that continue to provide evidence from across the nation.
5.2. Robustness Check
As a robustness check, we test for the significance of the difference in service usage between six months prior and seven to 12 months after housing for those clients who have been in the program for at least 12 months. Results are consistent with the findings for the six-month analysis. The tests show that clients had significantly less utilization of medical services and shelter. There are no significant differences in incarceration.
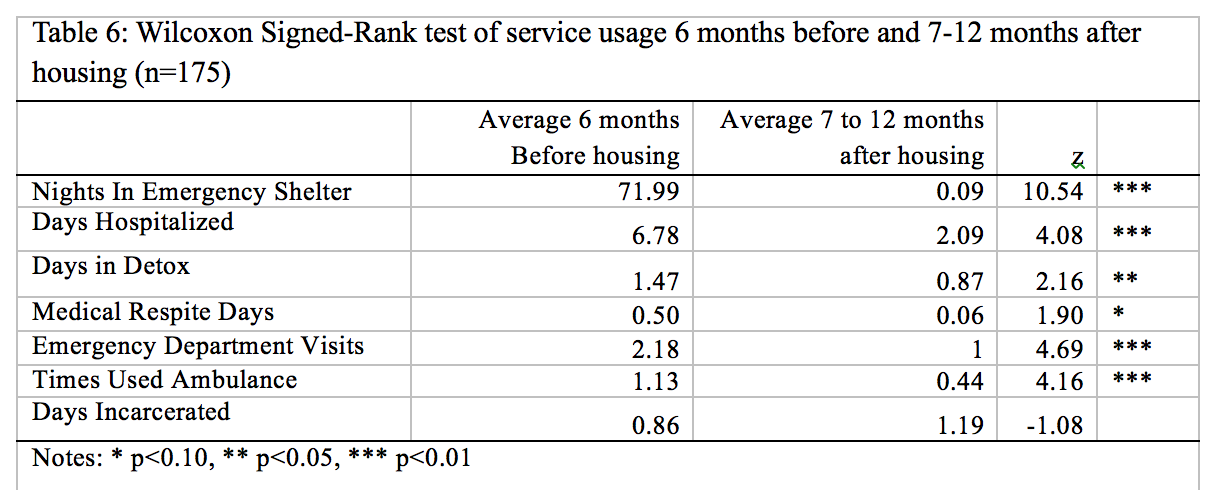
Overall, the analysis indicates that over the course of a year, there have been significant reductions in the use of public services after housing. The data shows prima facie evidence of an association between housing and utilization of services which allows us to claim that PFS housing was a determinant of the observed utilization outcomes. The design and evidence however is that of an observational study using program data, which cannot provide the evidence that housing is the cause of these utilization outcomes.
4.2. Cost-Benefit Analysis
In this section, we report the results of the cost-benefit analysis. Table 7 below shows the estimated cost of each service before and after housing entry, and the difference. Please see Appendix 1 to see the values we use to compute the estimated cost of each service.
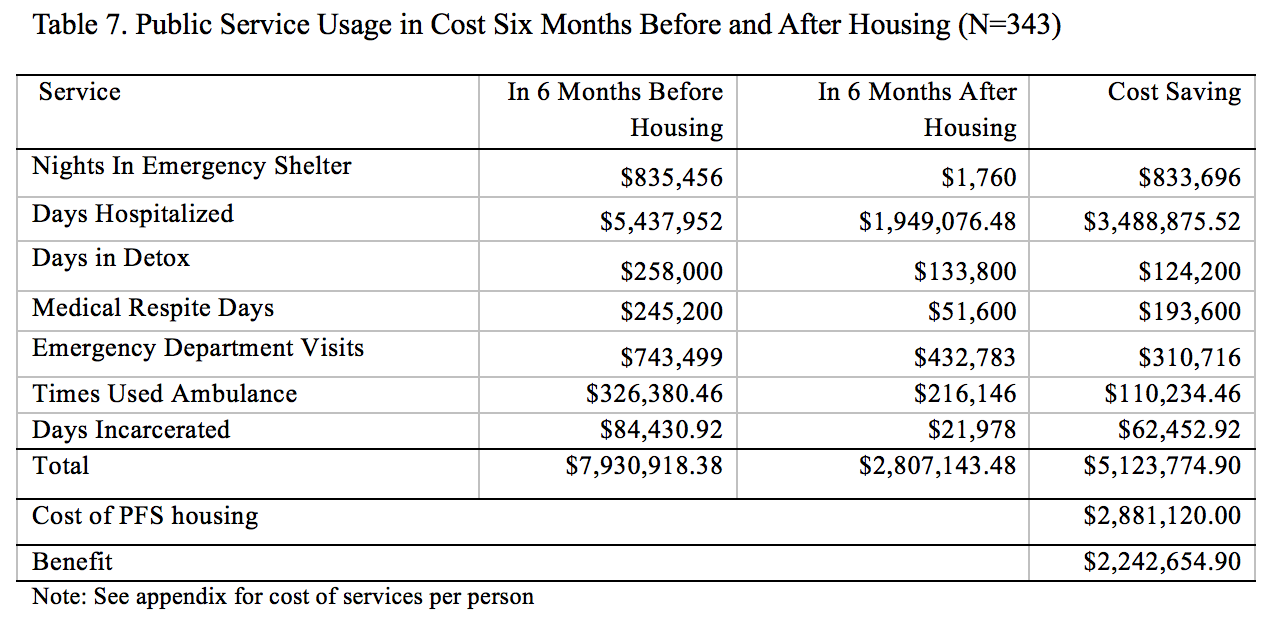
As Table 7 and Figure 1 show, comparison of collective service usage six months before and six months after housing indicates that savings were made on each service. Total use of services amounted to $7.9 million prior to housing entry and $2.8 million after. In terms of the breakdown, emergency shelter use reduced by about $833,696. The cost of hospitalization dropped by $3.5 million. The cost of detox use, medical respite and emergency department visits reduced by $124,200, $193,600 and $310,716 respectively. A saving of $110,234 was made based on reduced ambulance use.
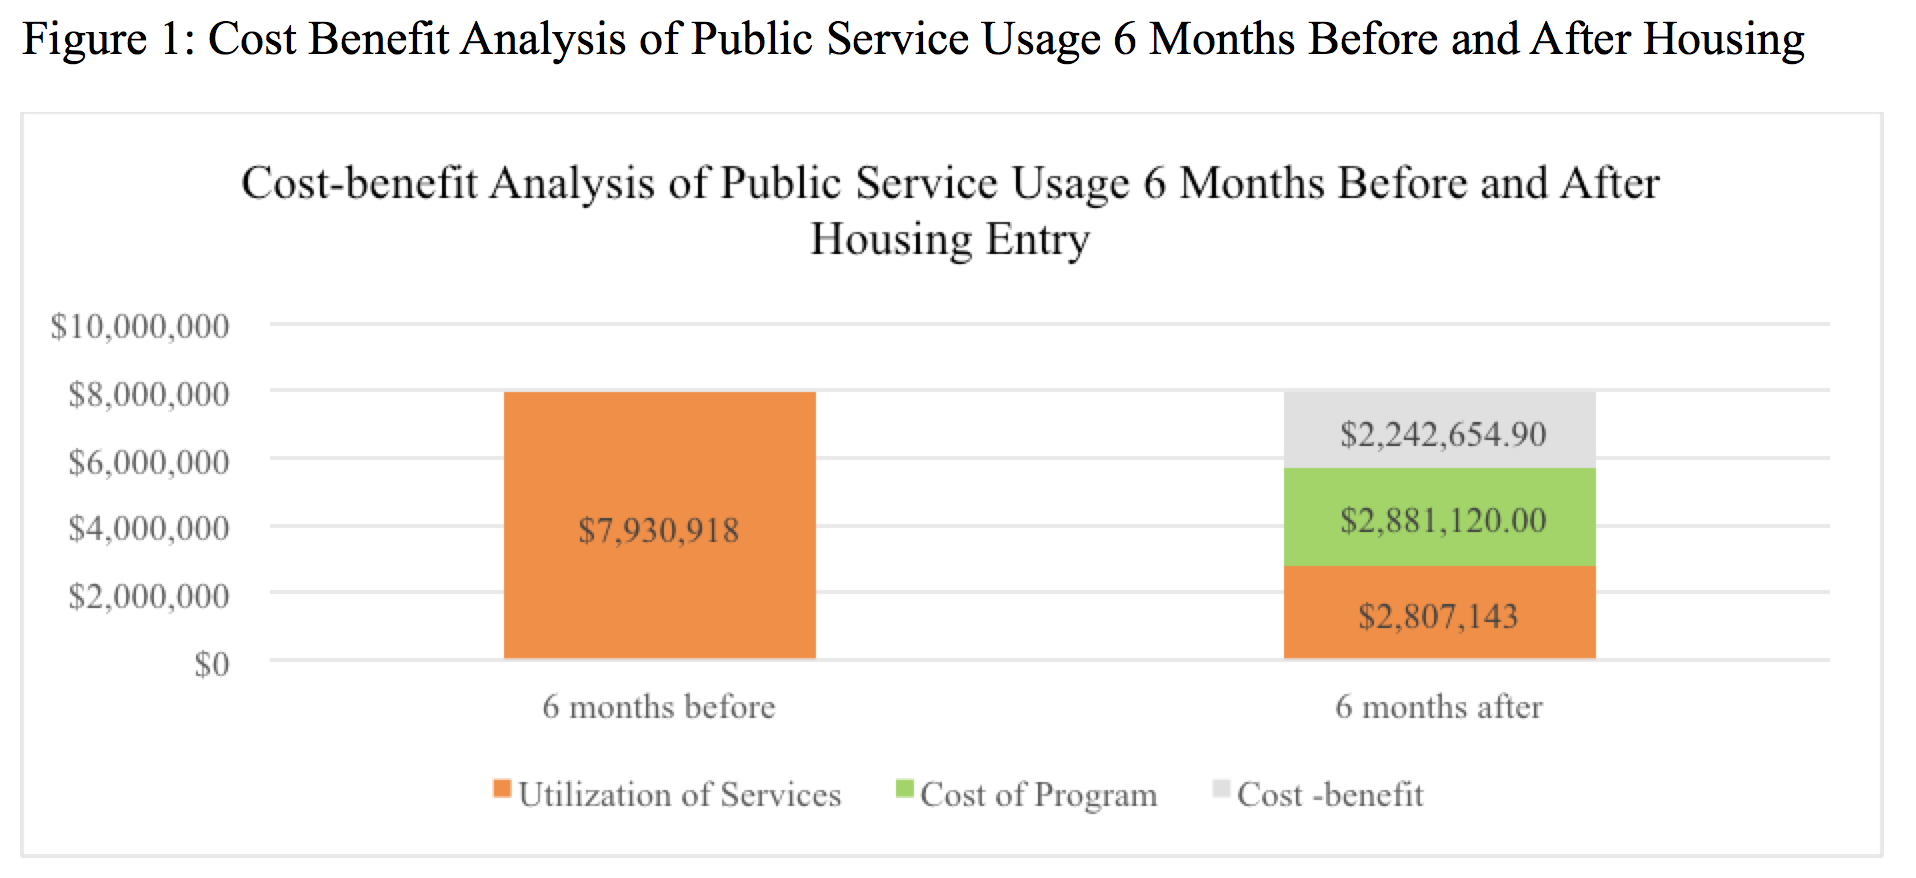
In terms of cost-benefit, the significant reductions in use of services amount to $2,242,654.90. The total reduction in cost-utilization between the period prior to and after housing is $5,123,774.90. Program costs over 6 months amount to $2,881,120.
4.3. Retention
With regard to retention, we find that there was a total of 424 clients in PFS as of December 31, 2016. Out of these, 94 had exited the program since it began. The table below shows the frequency distribution of exits and the reasons for exit.
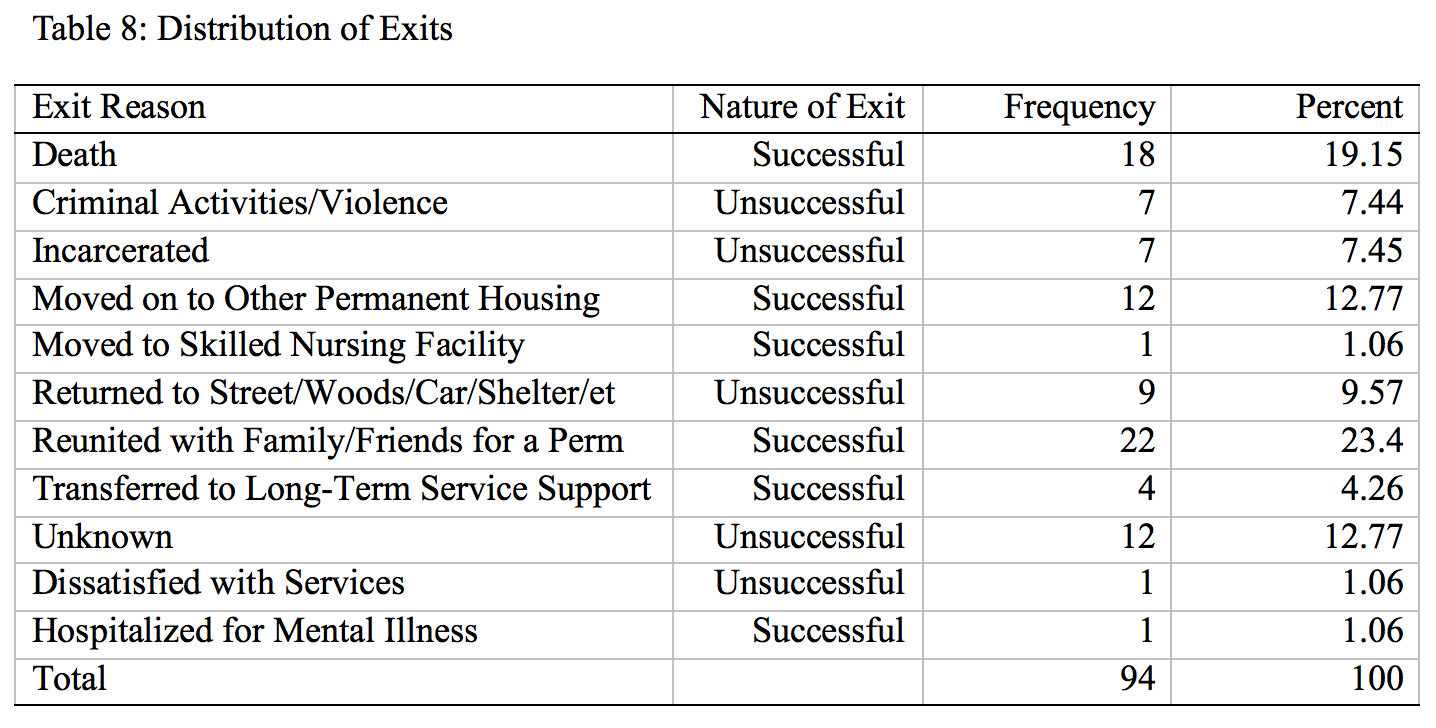
Successful exits were altogether 58, comprised of 18 who died in housing, 12 who moved to other permanent supportive housing, one who moved to a skilled nursing facility, 22 who were reunited with family, four who transferred to long term substance use care facility, and one who was hospitalized for mental illness. Unsuccessful exits were 36, with seven discharged from housing due to criminal activity or violence, seven who were incarcerated, nine who returned to the woods, one who was dissatisfied with services, and 12 who left for unknown reasons.
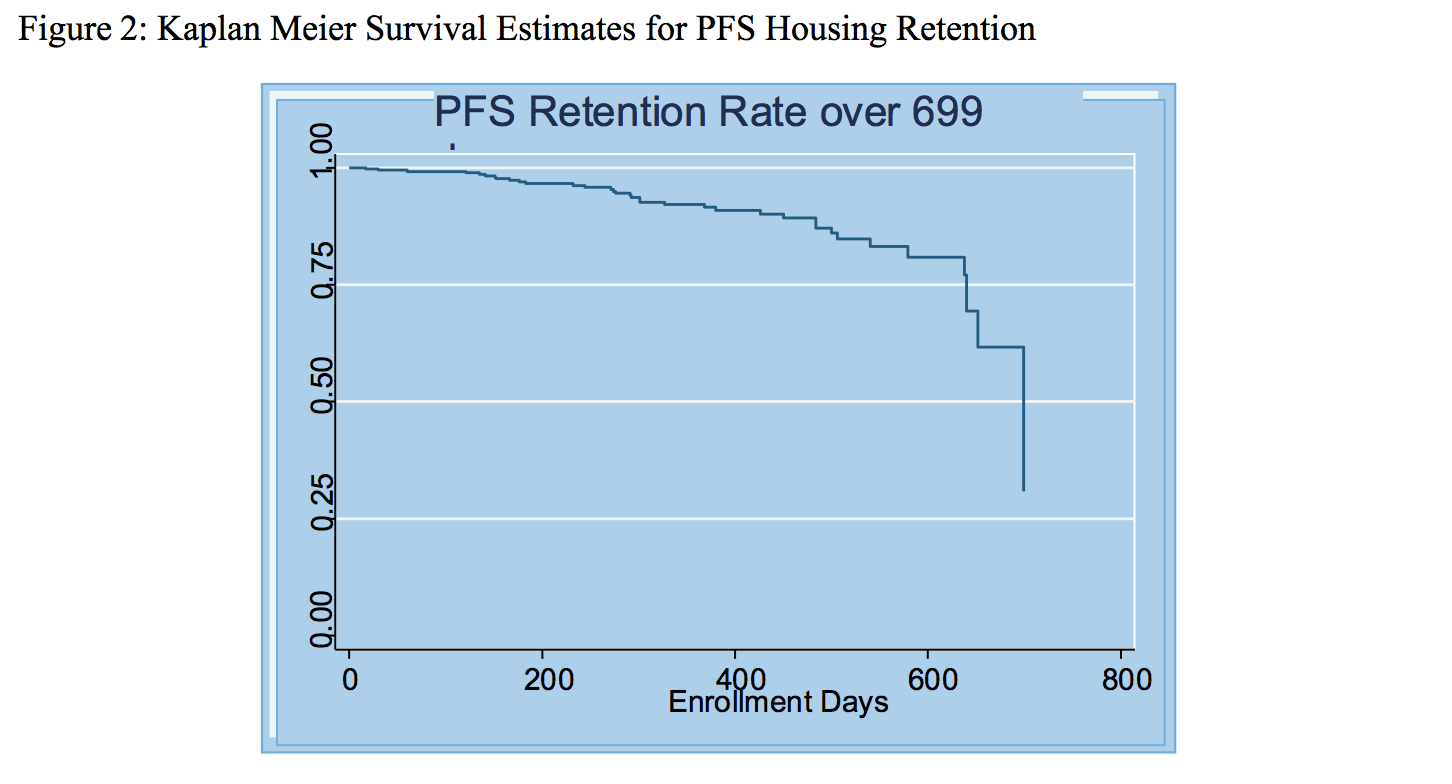
Using survival analysis and counting only unsuccessful exits, we find that after 365 days of PFS (June 2016), the retention rate is 92.1 percent. This is a higher rate than the target of 85 percent.
6. Conclusion
The Commonwealth and MHSA’s Social Innovation Financing Pay for Success program has successfully met its targets for housing retention, demonstrated a reduction in utilization of medical services by clients, and demonstrated a cost-benefit. The program has reduced the number of nights spent in emergency shelter, inpatient hospitalizations, and days spent in detox during the first six months and one year of housing for chronically homeless and high utilizers of health services. It has also brought much needed services to clients who could not otherwise have accessed services. In terms of cost-benefit analysis, the program made a total cost savings of $2.2 million after housing services were subtracted. Further, the retention rate was 92.2 percent after one year of implementation. Overall in its first year of existence, MHSA’s Pay for Success program has demonstrated success in housing and retaining the costliest segment of the homeless population, and long-term homeless adults who are high utilizers of emergency services. Cost savings amount to $2.2 million.
Works Cited
Bamberger, J. and Considine-Cortelyou, 2008. Changes in the lives of formerly homeless individuals in supportive housing S/A. Conference Presentation to the 136th APHA Annual Meeting and Exposition 2008
Buchanan, David; Romina Kee; Laura S. Sadowski; and Diana Garcia. 2009. The Health Impact of Supportive Housing for HIV-Positive Homeless Patients: A Randomized Controlled Trial. American Journal of Public Health 99 (S3): S675 – S680
Burns B.J., & Santos, A.B. (1995). Assertive community treatment: an update of randomized trials. Psychiatric Service. Vol.46 (7):669-75.
Corporation for Supportive Housing. 2013. Summary of Studies: Medicaid/Health Services Utilization and Costs. Providence, Rhode Island: CSH
Culhane, Dennis P., Stephen Metraux; and Trevor Hadley. 2002. Public Service Reductions Associated with Placement of Homeless Persons with Severe Mental Illness in Supportive Housing. Housing Policy Debates, Volume 13 (1): 107-163
Flaming Daniel, Patrick Burns, Michael Matsunaga, Gerald Sumner, Manuel H. Moreno, Halil Toros, and Duc Doan. 2009. Where We Sleep: Costs when Homeless and Housed in Los Angeles: Los Angeles: ECONOMIC ROUNDTABLE:
Hirsch, Eric, Irene Glasser, Roger Williams, Kate D’Addabbo and Jessica Cigna. 2008. Rhode Island’s Housing First Program Evaluation. United Way of Rhode Island and State of Rhode Island
Hoult, J., Reynolds, I., Charbonneau-Powis, M., Weekes, P, & Briggs, J. (1983). Psychiatric hospital versus community treatment: The results of a randomized trial. Australian and New Zealand Journal of Psychiatry, 17,160-167
HUD. (2016). Emergency Shelter [HUD] Law & Legal Definition. [Available: http://definitions.uslegal.com/e/emergency-shelter-hud/]
Larimer, Mary E., Daniel K. Malone, Michelle D. Garner, David C. Atkins, Bonnie Burlingham, Heather S. Lonczak, Kenneth Tanzer, Joshua Ginzler, Seema L. Clifasefi, William G. Hobson, G. Alan Marlatt. 2009. Health Care and Public Service Use and Costs Before and After Provision of Housing for Chronically Homeless Persons with Severe Alcohol Problems. JAMA. 301(13):1349-1357
Linkins Karen W. Jennifer, J. Brya and Daniel W. Chandler. 2008. Frequent Users of Health Services Initiative: Final Evaluation Report. California: The Lewin Group
Mackelprang, Jessica L., Susan E. Collins and Seema L. Clifasefi. 2014. Housing First is Associated with Reduced Use of Emergency Medical Services. Prehospital Emergency Care 18(4): 476 - 482
Martinez, T.E. & Burt, M. (2006) Impact of Permanent Supportive Housing on the Use of Acute Care Health Services by Homeless Adults. Psychiatric Services. Vol. 57(7): 1-8
Mondello, Mellany, Anne B. Gass, Thomas McLaughlin and Nancy Shore. 2007. Cost of Homelessness: Cost Analysis of Permanent Supportive Housing. Portland, Maine: The State of Maine
Moore, T.L., (2006, June). Estimated cost savings following enrollment in the Community Engagement Program: findings from a pilot study of homeless dually diagnosed adults. Portland, OR: Central City Concern
Mulder, R. (1985). Evaluation of the Harbinger Program, 1982-1985. Lansing, Michigan: Department of Mental Health.
Nogaski Alyssa, Amy Rynell, Amy Terpstra, and Helen Edwards. 2009. Supportive Housing in Illinois: A Wise Investment. Illinois: The Heartland Alliance Mid-America Institute on Poverty
O’Connell, JJ, Swain S. Rough Sleepers: a Five Year Prospective Study in Boston, 1999-2003. Presentation, Tenth Annual Ending Homelessness Conference, Massachusetts Housing and Shelter Alliance, Waltham, MA 2005
Olfson, Mark. (1990). Assertive Community Treatment: An Evaluation of the Experimental Evidence. Psychiatric Services. Vol. 41(6): 634-641
Stein, L., & Test, M. A. (1980). Alternative to mental hospital treatment I: Conceptual model, treatment program, and clinical evaluation. Archives of General Psychiatry, 37, 392-397
Test, M. A. (1992). Training in community living. In R. P Liberman, (Ed.), Handbook of psychiatric rehabilitation. (pp. 153-170). New York: Macmillan Publishing Company Weisbrod,
Test, M. A., & Stein, L. (1980). Alternative to mental hospital treatment III: Social cost. Archives of General Psychiatry, 37, 409-412
US Government. 2015. Federal Register, Friday December 4, 2015 Vol.80 (233): 75791 – 75806
Wright, Bill J., Keri B. Vartanian, Hsin-Fang Li, Natalie Royal and Jennifer K. Matson. 2016. Formerly Homeless People Had Lower Overall Health Care Expenditures After Moving Into Supportive Housing. Health Affairs, 35, no.1 (2016):20-27
Appendix A: Computations for Estimation of the Cost of Use of Public Services
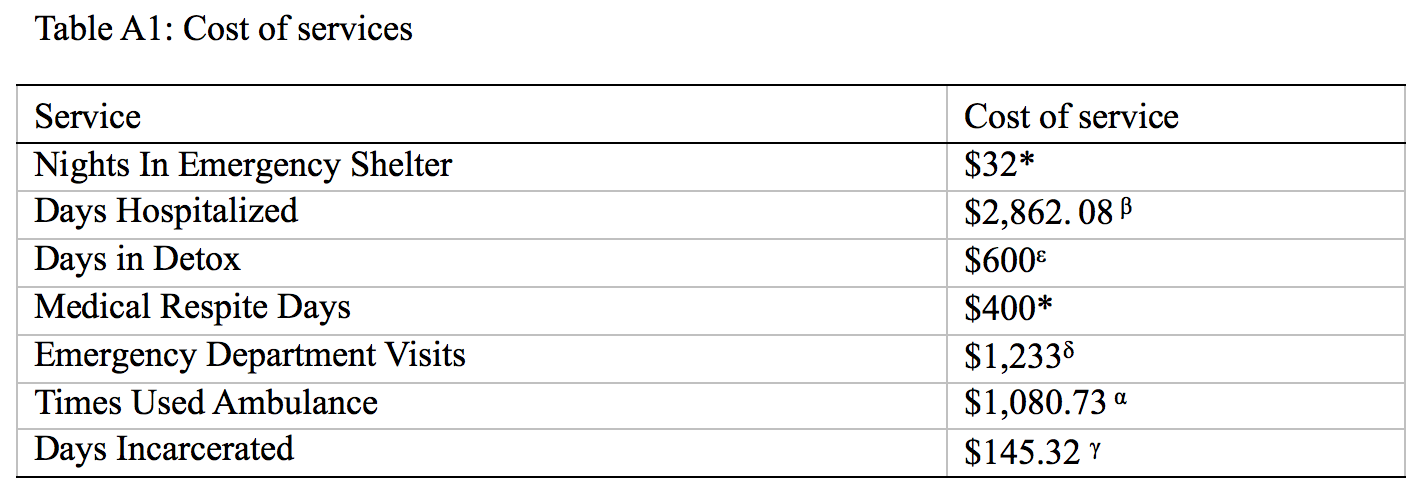
α Center for Medicaid and Medicare Services. 2016. Ambulance Fee Schedule Public Use Files [Available 11/30/2016: Link]. The fee was computed using the provided formulas. This value is an average of the cost for procedure codes A0426, A0427, A0428 and A0429
β The Henry J. Kaiser Family Foundation. 2014. Hospital Adjusted Expenses per Inpatient Day by Ownership [Available 11/30/2016: Link]. This value is the maximum value reflected in non-profit hospitals.
γ Massachusetts Department of Corrections. 2014. Frequently Asked Questions [Available 11/30/2016: Link]. This value is a daily average. For Fiscal Year 2014, the average cost per year to house an inmate in the Massachusetts DOC was $53,040.87. We divide $53,040.87 by 365 days to obtain $145.32 per day.
δ Nolan Caldwell1, Tanja Srebotnjak, Tiffany Wang, Renee Hsia. 2013. ‘‘How Much Will I get Charged for This?’’ Patient Charges for Top Ten Diagnoses in the Emergency Department. PIOS Vol. 8(2) – 1-6. This is a National Institute of Health study that examined 70,000 emergency department visits nationwide to come up with the median costs. The value reflected is the median cost.
ε This is the minimum cost. Information was obtained from Appleton under McLean, Westminster Treatment Center and Wicked Sober
* No review. New figures not yet obtained